by David Hulchanski and Richard Maaranen, Cities Centre, University of Toronto, November 2008
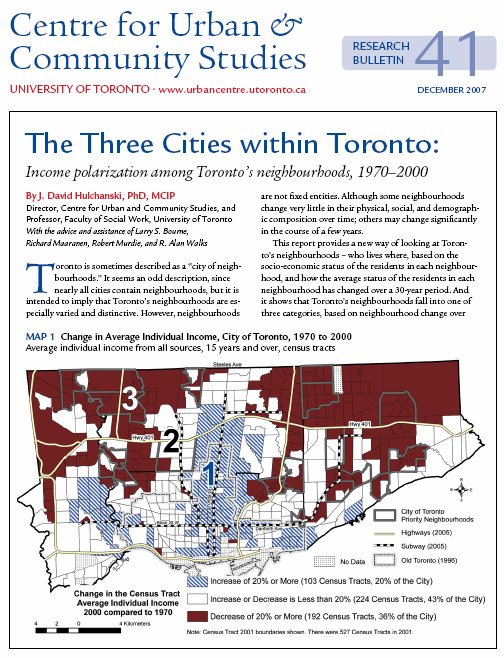
One-third of the City of Toronto’s neighbourhoods (census tracts) have a consistent pattern of either increasing or decreasing in average individual income over the past 25 years compared to the Toronto area average. This trend leads to the creation of more higher income and more lower income neighbourhoods, at the expense of average or middle-income neighbourhoods.
For PDF of map, click here.

On the way up.
Nine percent of Toronto’s census tracts have been increasing in average individual income. These 46 areas are joining or have joined the ranks of the city’s higher income areas. Most are also located adjacent to Toronto’s already higher income neighbourhoods – a further clustering and consolidation of a demographic that is not only financially well of, but also mainly white with a relatively small share of Toronto’s celebrated ethnocultural diversity.
On the way down.
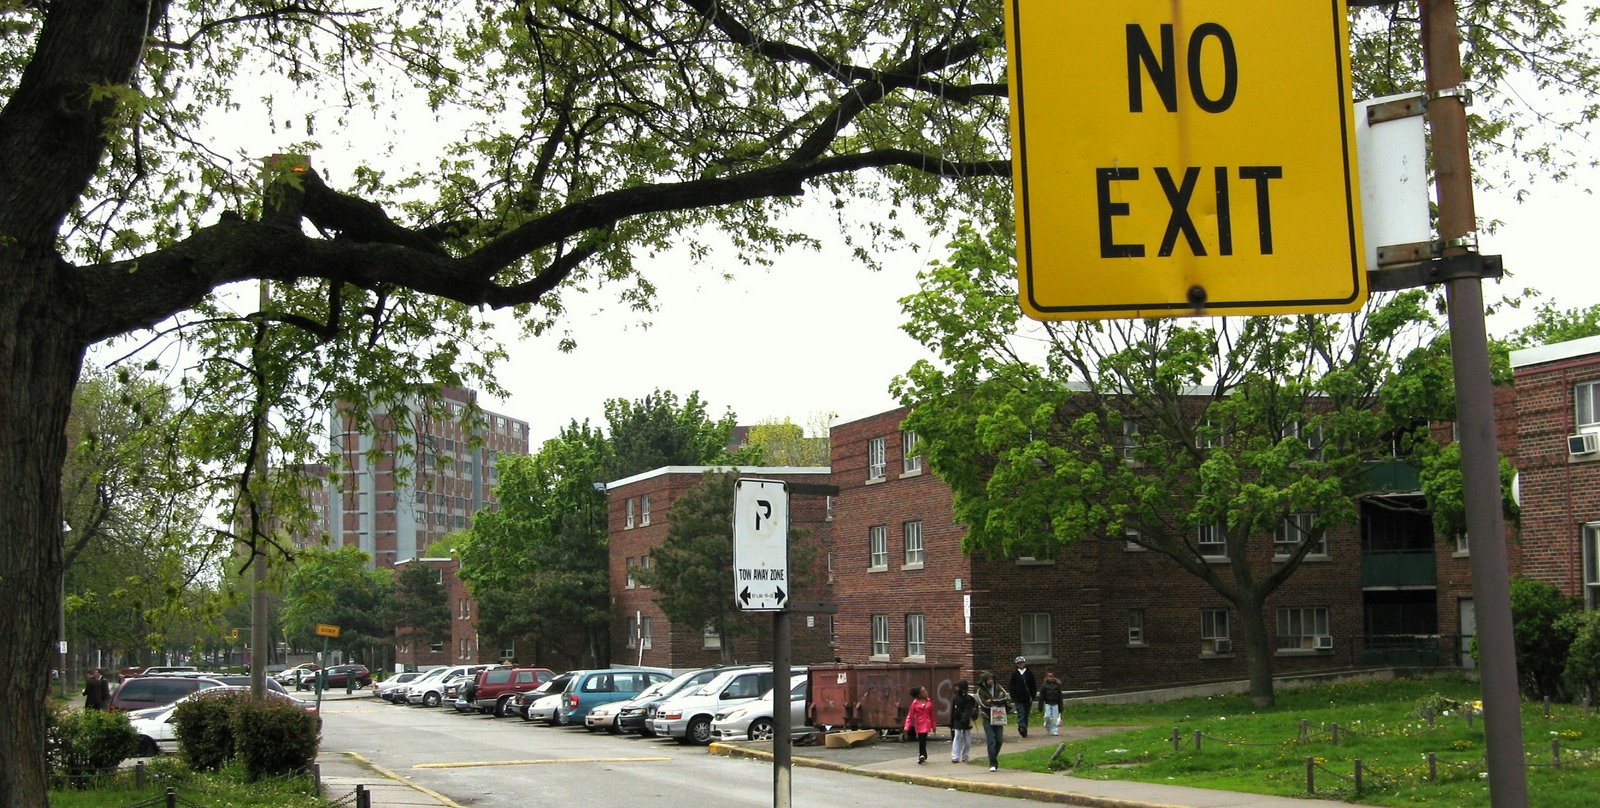
Many more neighbourhoods, however, 128 census tracts (25% of the city), have been consistently declining in average individual income for the two and half decades. These formerly poor and middle-income areas are now much poorer. Most are in the car-oriented inner suburbs built in the 1950s to the 1970s. These areas are mainly and increasingly non-white with a disproportionate share of newcomers.
Still in the middle.
Two-thirds of the city’s neighbourhoods (341 census tracts) do not have a persistent direction of change but many are still better off or worse off now compared to 25 years ago. Of these, 88 are 10% or more better off in 2005 than 1980 (17% of the City) and 130 are 10% or more worse off over the same period (25% of the City). Relative stability, that is, income is neither 10% higher or lower in 2005 than 1980, only occurred in the remaining 123 census tracts (24% of the City).
The map shows only persistent change among Toronto’s census tracts over the past 25 years. It is not a map of rich and poor areas. It is a map of change.
What is significant, in addition to the fact that fully one-third of the city has a consistent upward or downward income trajectory over such a long period, is that there is a high degree of geographic concentration within the trend. The pattern is not random. Wealthy and poor areas are consolidating. Those who have choice – enough money to choose their neighbourhood, are abandoning parts of the city.
-------------------------------------------
Note on Method
How was the change calculated? The map is based on an analysis of census average individual income for five census years (1981, 1991, 1996, 2001, 2006).
For each census tract in each of the five years, the extent to which the census tract’s average individual income was above or below the Toronto CMA average was calculated. We use the Census Metropolitan Area (CMA) average rather than the City of Toronto average as an income baseline because the urban labour and housing market has grown much larger than the City itself over the past 25 years. In addition, there is very little difference between the CMA and City average individual income.
Census Tracts that were geographically larger in years prior to 2001 have had their income estimated to their smaller subdivided 2001 census tract boundaries assuming equal incomes in each part. This is necessary in order to hold the number of census tracts in the City of Toronto fixed over time. From this set of census tracts we produce and map the list of the census tracts that consistently went up or down.
Individual income is the census category for income of persons 15 and over from all sources. It has an advantage over household income for determining the socio-economic status of people living in an area as it controls for differences in household size. The number of persons in each household with income is increasingly uneven across the City with a large divide between the downtown area and the suburbs. Median income is not used here because it has the disadvantage of hiding the extent of the high and low incomes, since most neighbourhoods have at least a few high or low-income people. Use of any of the income categories in the census, however, produces similar results. This is discussed further in: J.D. Hulchanski, The Three Cities Within Toronto: Income polarization, 1970–2000, CUCS Research Bulletin #41, December 2007.